Getting enhanced PUF targets
Mockup in R
1 Introduction
This target-getting project implements, in R, a way to get summary data on tax return items for historical years from IRS spreadsheets. These data, sometimes with adjustment, may be used to construct aggregate and distributional potential targets for PUF variables. The project creates a csv file with a large number of potential targets. I do not expect that we will target all of these items, but rather will choose a subset to target.
The csv file is in the data folder of Boyd’s taxdata-psl project.
The code that creates the csv file and this website is in the targets_mockup folder in Boyd’s taxdata-psl project.
This web page has a useful datatable in Section 2.7 that displays the potential targets and allows filtering and sorting to explore the targets.
I envision that in the short term (Phase 2 and perhaps even Phase 3) we will use the output of this project – the csv file of potential targets – to help set targets for historical years. In the longer run I expect that Nikhil will develop a python approach to getting targets, no doubt better than this, although perhaps he will start by translating this code to python.
At present, the project focuses on four important IRS tables that have a superset of most if not all of the targets we will want. The tables, with the IRS spreadsheet name for 2021 in parentheses, are:
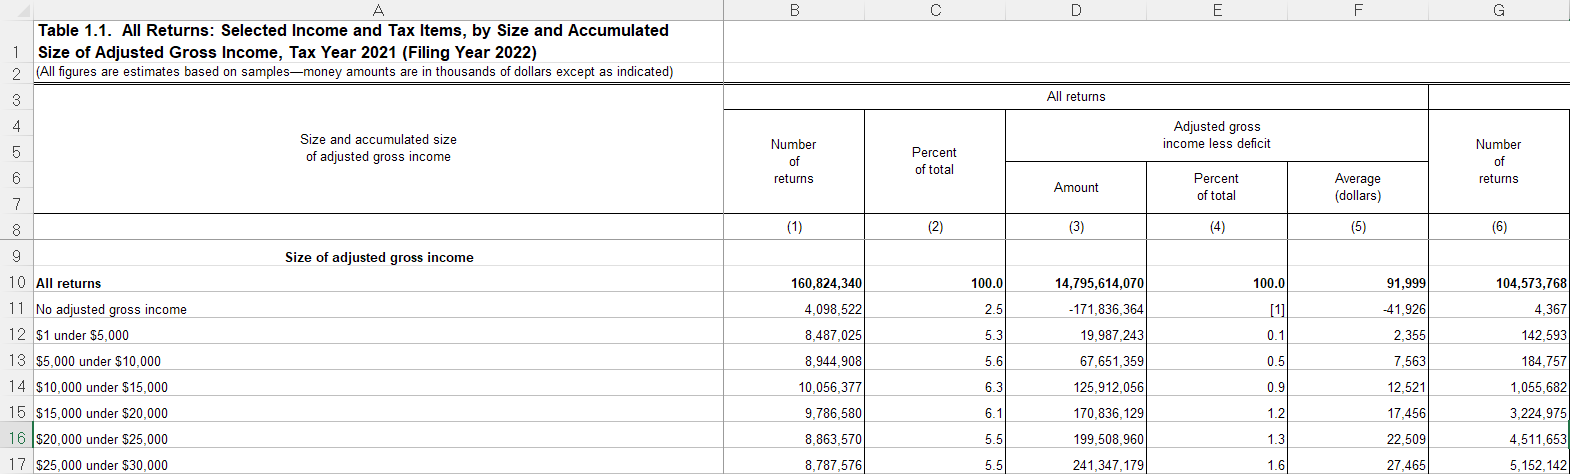
Table 1.1. All Returns: Selected Income and Tax Items, by Size and Accumulated Size of Adjusted Gross Income (21in11si.xls)
Table 1.2. All Returns: Adjusted Gross Income, Deductions, and Tax Items, by Size of Adjusted Gross Income and by Marital Status (21in12ms.xls)
Table 1.4. All Returns: Sources of Income, Adjustments, and Tax Items, by Size of Adjusted Gross Income (21in14ar.xls)
Table 2.1. Returns with Itemized Deductions: Sources of Income, Adjustments, Itemized Deductions by Type, Exemptions, and Tax Items, by Size of Adjusted Gross Income (21in21id.xls)
Note that the filename gives information on the file content: the first two characters give the year (e.g., 21=2021), the next two characters tell the tax type (in=individual income tax), the next two tell the table number (11=Table 1.1, … 21=Table 2.1), and the last two give more details on the content (ar=all returns, id=itemized deductions, ms=marital status, si=sources of income).
At present, this project focuses on two key IRS years: 2015, which is the year for which we have the PUF, and 2021, the latest available year. We may add 2017, the last year before the Tax Cuts and Jobs Act (TCJA). The TCJA changed the individual income tax dramatically and changed available data as well, for example significantly reducing the number of returns that claimed itemized deductions. We might also add 2018, the first year under the new tax system.
1.1 General approach
The idea is to make it as easy and minimally error prone as possible to define how to get targets from IRS spreadsheets and convert them into a data frame that then is saved as a csv file.
The approach is to create a “recipes” spreadsheet by hand that provides names and web locations of all relevant IRS tables and, for each IRS table, has a mapping tab that defines locations (Excel rows and columns) for data of interest.
A computer program reads the recipes spreadsheet, downloads the IRS spreadsheet files, reads selected information from each IRS spreadsheet file as defined in the corresponding mapping tab, rearranges data as needed to create a usable data frame, and saves the data frame as a csv file.
The goal is to make this easily extensible with minimal risk of error, allowing us to add additional years of data when the IRS releases new data, or to add additional tables, or additional columns within IRS tables.
1.2 Overview of steps
The basic steps are:
Manually create an Excel file, target_recipes.xlsx, with the following tabs:
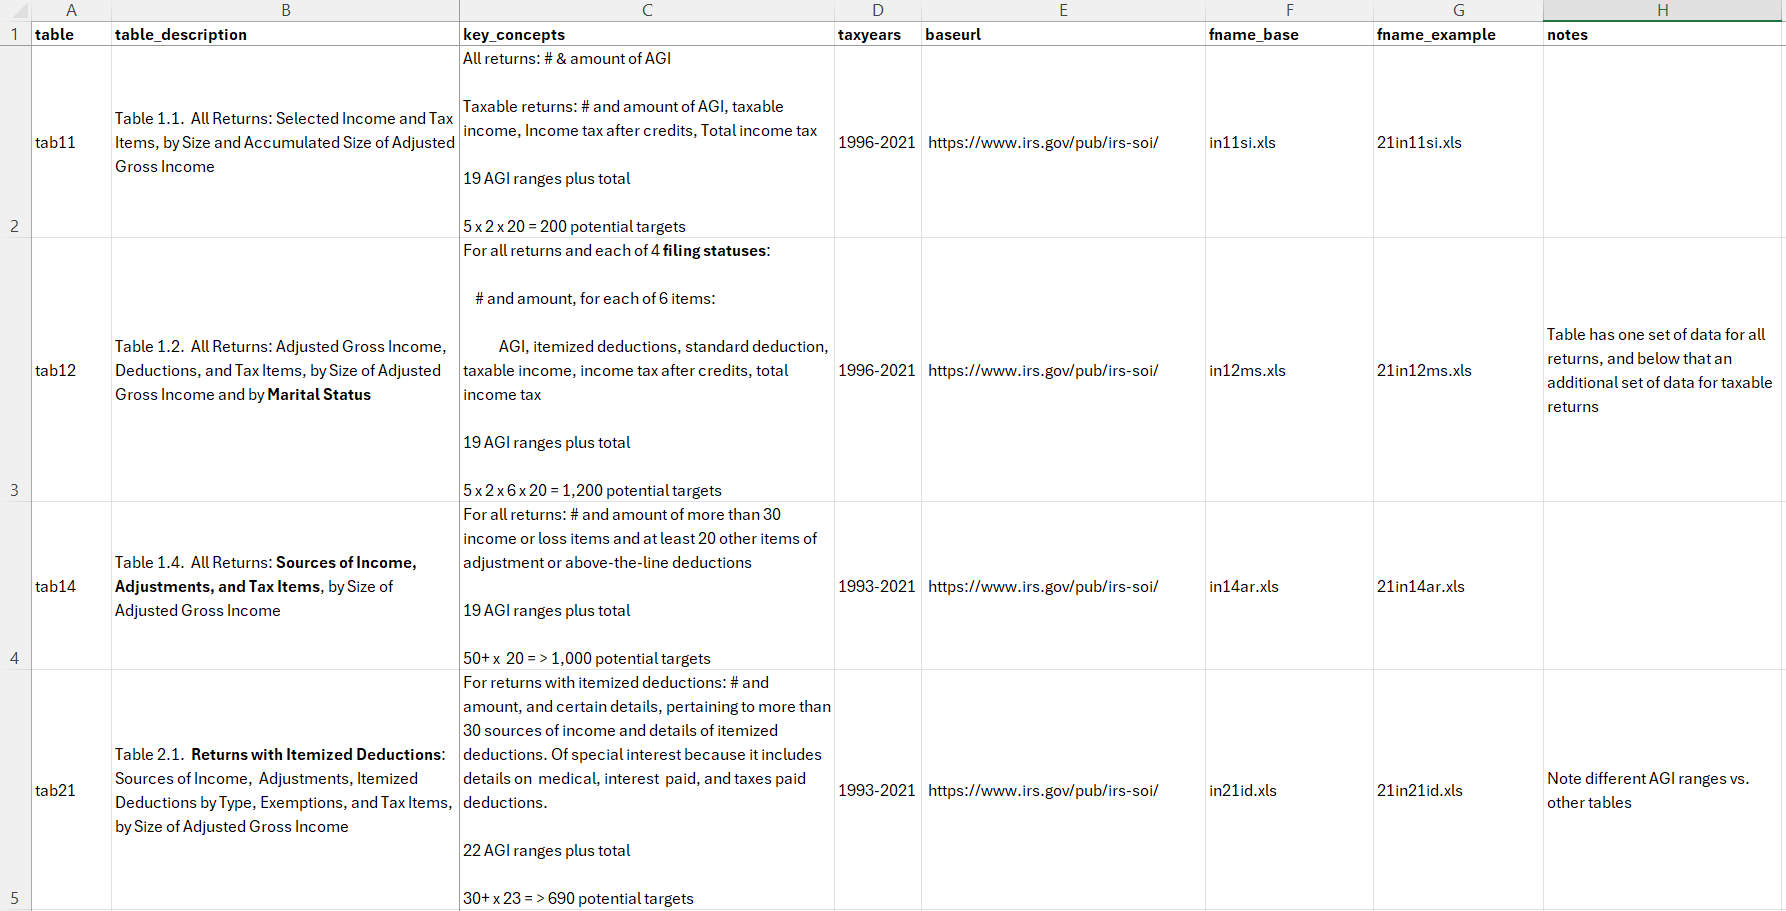
irs_downloads: Defines the IRS spreadsheets to download and provides certain information about these files:
table- variable name for table, used in R programs (for exampletab11corresponds to IRS Table 1.1)table_description- IRS table descriptionkey_concepts- key targeting concepts included in the spreadsheettaxyears- tax years for which the spreadsheet is availablebaseurl- url for IRS folder that contains the filefname_base- base filename before giving the year of the filefname_example- example file name for a specific year.notes- additional information about the table
Here is a screenshot of this tab:
Several “mapping” tabs, each of which corresponds to an IRS table (e.g.,
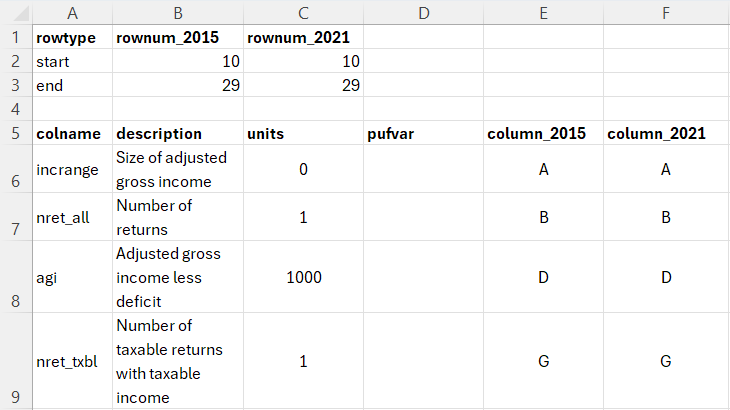
tab11_mapcorresponds to IRS Table 1.1). Each such tab maps key information in the spreadsheet so that it can be read in an automated fashion. Each mapping tab has two sections: (1) a section at top that tells, for each year of interest, the starting row and ending row for key information in the IRS table, and (2) below that, a section that says where key columns of interest are located, giving:colname- R variable name to be used for the columndescription- description of the columnunits- units for the datapufvarcorresponding PUF variable name, if knowncolumn_{year}- a set of columns, each of which gives the Excel letter for the IRS spreadsheet column for a year of interest
The screenshot below shows information in the mapping tab
tab11_map, which provides information on IRS Table 1.1:
The mapping tab also includes selected screenshots from corresponding IRS spreadsheet files that show what the IRS file looks like.
An R program reads the mapping information for a particular table and uses it to read a corresponding IRS Excel spreadsheet. The program pulls columns of interest from the IRS spreadsheet and creates a dataframe with column names shown in the colname column of the mapping tab.
Here is an excerpt from Table 1.1 for 2021 (21in11si.xls). It shows that the data start in row 10 of the spreadsheet and that column A has the AGI range, B has the number of returns, D has AGI, and G has number of returns with taxable income, consistent with the mapping tab above: